

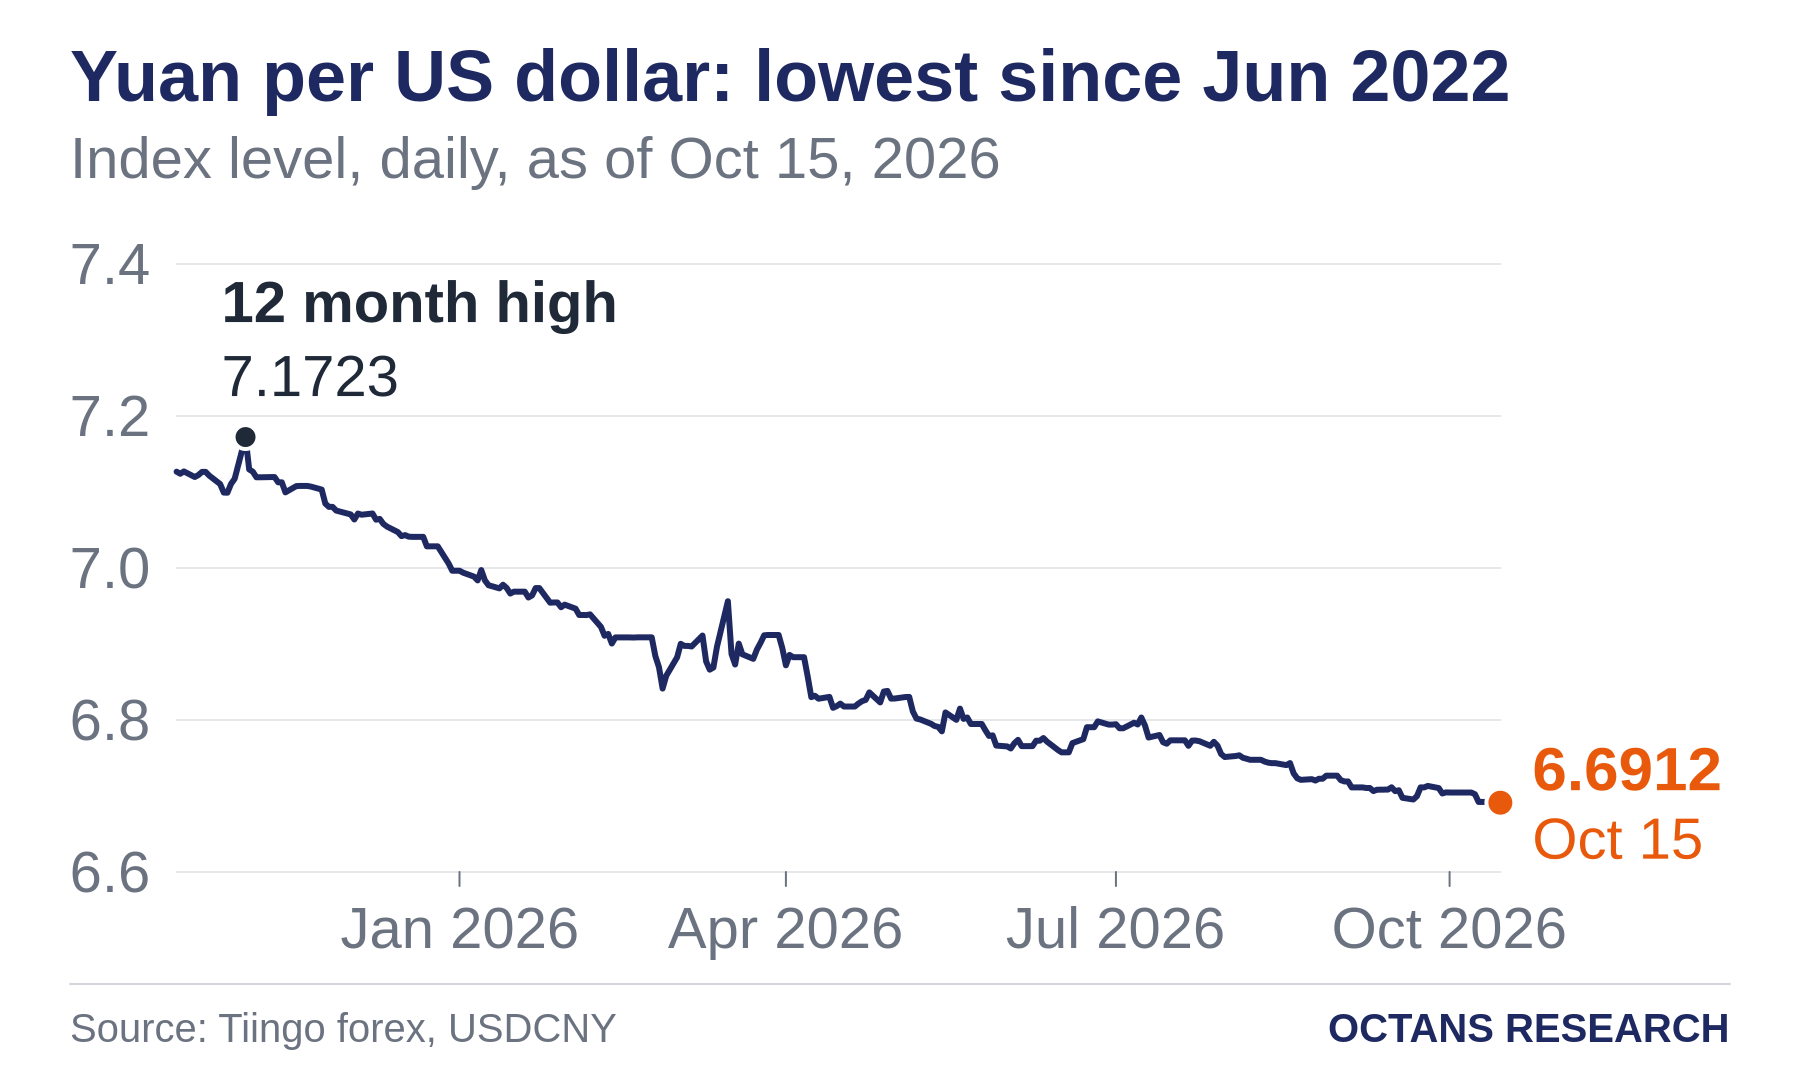
Chinese yuan per US dollar at 6.6912, lowest since June 2022
A daily reading from Tiingo forex data, compared with the full history of the series.
Snapshot
The yuan per US dollar exchange rate was 6.6912 yuan per US dollar on Oct 15, 2026, the lowest reading since Jun 24, 2022, more than 4 years ago.
- Independent Research
What We Know
The previous reading was 6.6928 yuan per US dollar on Oct 14, 2026, so the latest is unchanged. A year earlier it was 7.1267 yuan per US dollar; it is down 6.1% since. The lowest reading in data back to Jan 1, 2020 is 6.3094 yuan per US dollar on Feb 28, 2022.
Octans View
This is a level record for the series, not a forecast: it says the yuan per US dollar exchange rate is lower than at any point in more than 4 years of readings, and nothing about where it goes next.
Bear Case · Room for Disagreement
Limits. The comparison uses published readings, not intraday levels, and only the history this source carries. Method and source. Octans Research computes the record from the full history of Tiingo series USDCNY; the running page "Where the yuan per US dollar exchange rate stands versus its history" tracks the series every day. No model wrote this text.
Sources
- [1]Tiingo — Market data sourced by Tiingo
These are the sources this piece was drafted from. How we verify. Found an error? Tell us and we correct it in public.
6.1%
4 reports
Where the yuan per US dollar exchange rate stands versus its history
The yuan per US dollar exchange rate was 6.6912 yuan per US dollar on Oct 16, 2026, in the lower third of its 12 month range. Updated when Tiingo forex data publishes a new reading.
Where the yen per US dollar exchange rate stands versus its history
The yen per US dollar exchange rate was 157.99 yen per US dollar on Oct 16, 2026, in the middle third of its 12 month range. Updated when Tiingo forex data publishes a new reading.
Where the Federal Reserve's broad US dollar index stands versus its history
The Federal Reserve's broad US dollar index was 121.60 on Oct 9, 2026, in the upper third of its 12 month range. Updated when the Federal Reserve Board (H.10) publishes a new reading.
Where the VIX volatility index stands versus its history
The VIX volatility index was 16.46 on Oct 15, 2026, in the lower third of its 12 month range. Updated when Cboe Global Markets publishes a new reading.