

TG Therapeutics quarterly revenue jumps 60.7% to $259.9 million
TG Therapeutics' revenue growth is slowing. Results for the quarter ended September 30, 2026, from the earnings release filed with the SEC on Nov 9, 2026.
Snapshot
TG Therapeutics' revenue growth is slowing: revenue jumped 60.7% to $259.9 million in the quarter ended September 30, 2026, from $161.7 million a year earlier, after 70.3% year over year growth the quarter before.
- Independent Research
Market Data
| Company | 1D % | Price |
|---|---|---|
| ($TGTX) | ▲ +1.39% | 64.26 |
as of 16:00 ET · Realtime derived data
What We Know
Revenue for the quarter ended September 30, 2026 was $259.9 million, versus $161.7 million in the same quarter a year earlier, up 60.7%. That is its highest quarterly revenue of the last eight quarters. Diluted earnings per share was $0.35, down from $2.43.
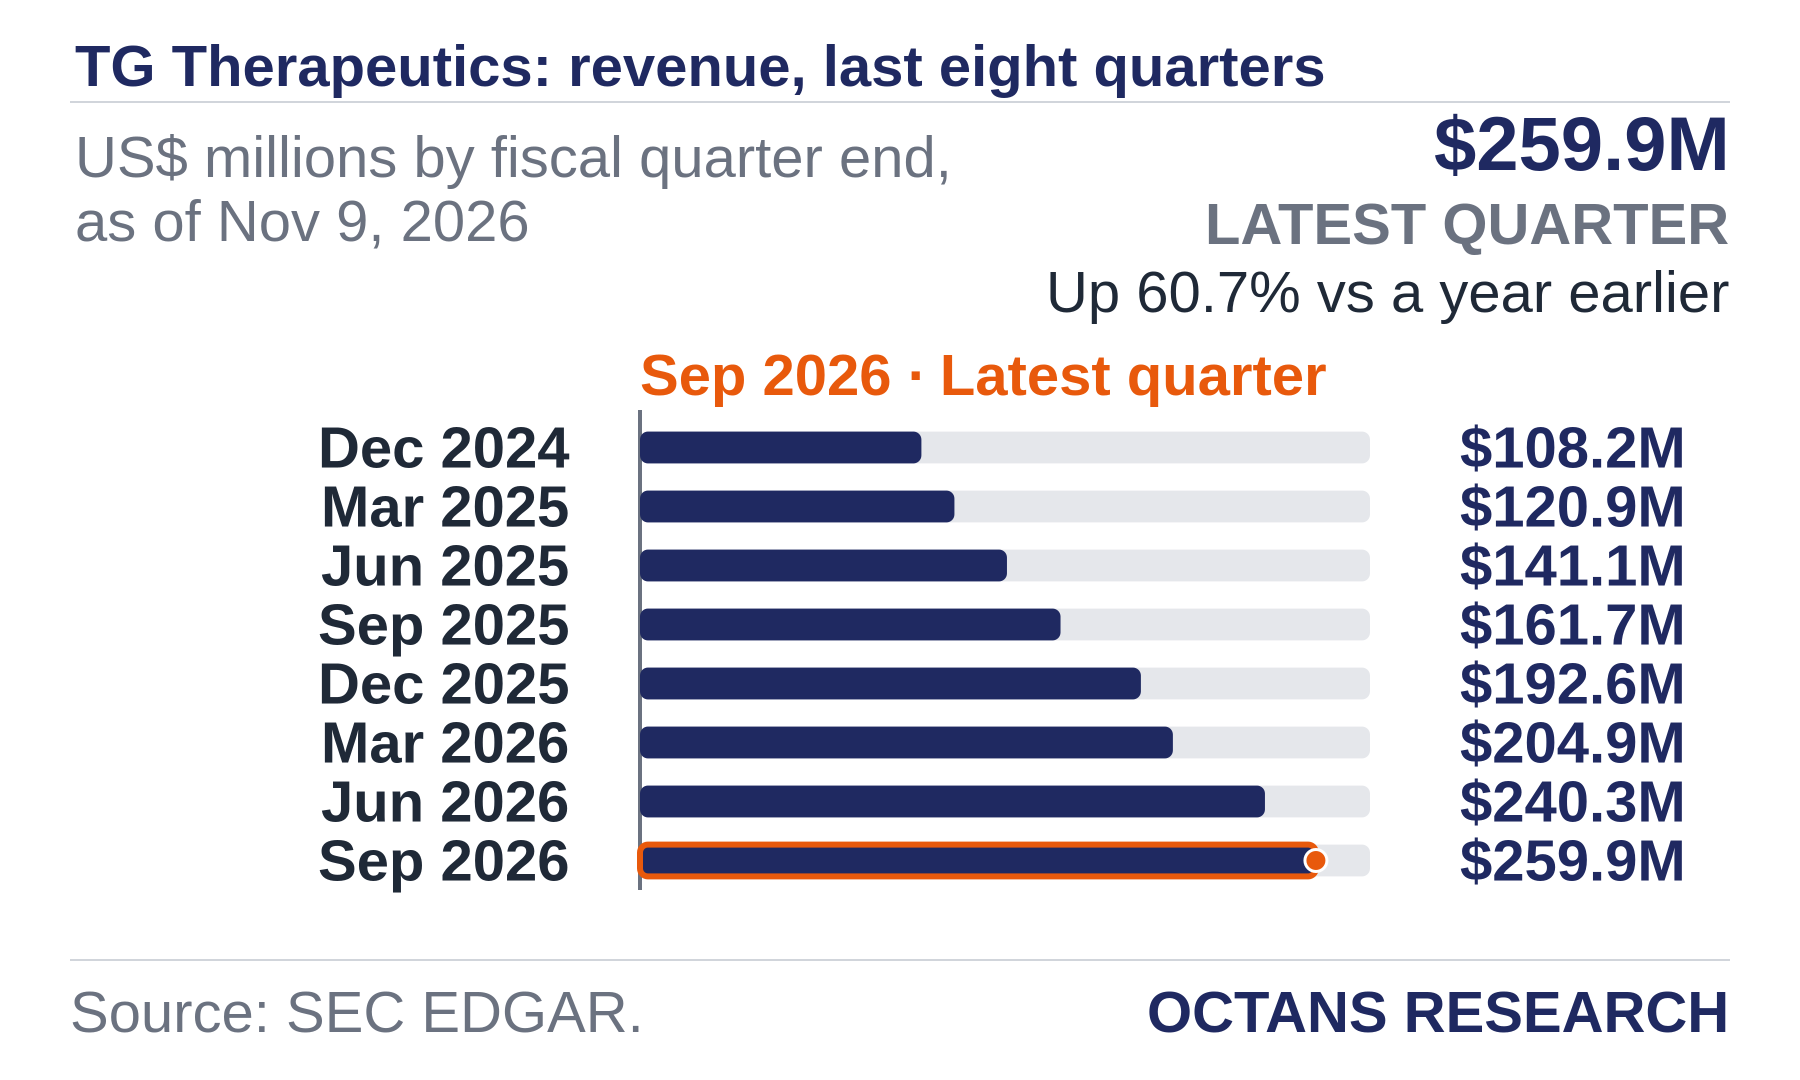
Quarterly revenue by fiscal quarter end, oldest first: Dec 2024: $108.2 million; Mar 2025: $120.9 million; Jun 2025: $141.1 million; Sep 2025: $161.7 million; Dec 2025: $192.6 million; Mar 2026: $204.9 million; Jun 2026: $240.3 million; Sep 2026: $259.9 million.
Octans View
Year over year revenue change by quarter, computed from the filed figures: Dec 2025 up 78.0%; Mar 2026 up 69.6%; Jun 2026 up 70.3%; Sep 2026 up 60.7%. On those figures, TG Therapeutics' revenue growth is slowing. That read compares the latest two year over year growth rates and nothing else.
Bear Case · Room for Disagreement
This brief covers reported revenue and diluted earnings per share only. It does not cover guidance, margins, segment results, cash flow or the earnings call, and it makes no forecast. Revenue is the total on the release line we matched; a company's own adjusted measures can differ.
Method and source. Octans Research matched the revenue line in the earnings release (Exhibit 99.1) to the year ago quarter the company reported in its own XBRL financial data; the two must agree before anything is published. The quarterly history comes from the same XBRL data. The text is generated from those verified figures by a fixed template; no model wrote it.
Chart
Sources
- [1]SEC EDGAR — TG Therapeutics earnings release for the quarter ended September 30, 2026 (Exhibit 99.1), filed Nov 9, 2026
- [2]SEC EDGAR — TG Therapeutics XBRL financial data (company facts)
These are the sources this piece was drafted from. How we verify. Found an error? Tell us and we correct it in public.
$259.9M
More on $TGTX
4 reports
Silicon Laboratories quarterly revenue rises 21.8% to $250.9 million
Silicon Laboratories' revenue growth is speeding up. Results for the quarter ended October 3, 2026, from the earnings release filed with the SEC on Nov 10, 2026.
D Wave Quantum quarterly revenue rises 20.7% to $4.5 million
D Wave Quantum is growing again. Results for the quarter ended September 30, 2026, from the earnings release filed with the SEC on Nov 10, 2026.
Venture Global quarterly revenue jumps 42.9% to $4.76 billion
Venture Global's revenue growth is slowing. Results for the quarter ended September 30, 2026, from the earnings release filed with the SEC on Nov 10, 2026.
Sanmina quarterly revenue jumps 84.0% to $3.86 billion
Sanmina's revenue growth is speeding up. Results for the quarter ended October 3, 2026, from the earnings release filed with the SEC on Nov 9, 2026.