

US initial jobless claims fell to 194,000 in the week ended Oct 17, 2026
Weekly unemployment insurance claims, published by the Department of Labor.
Snapshot
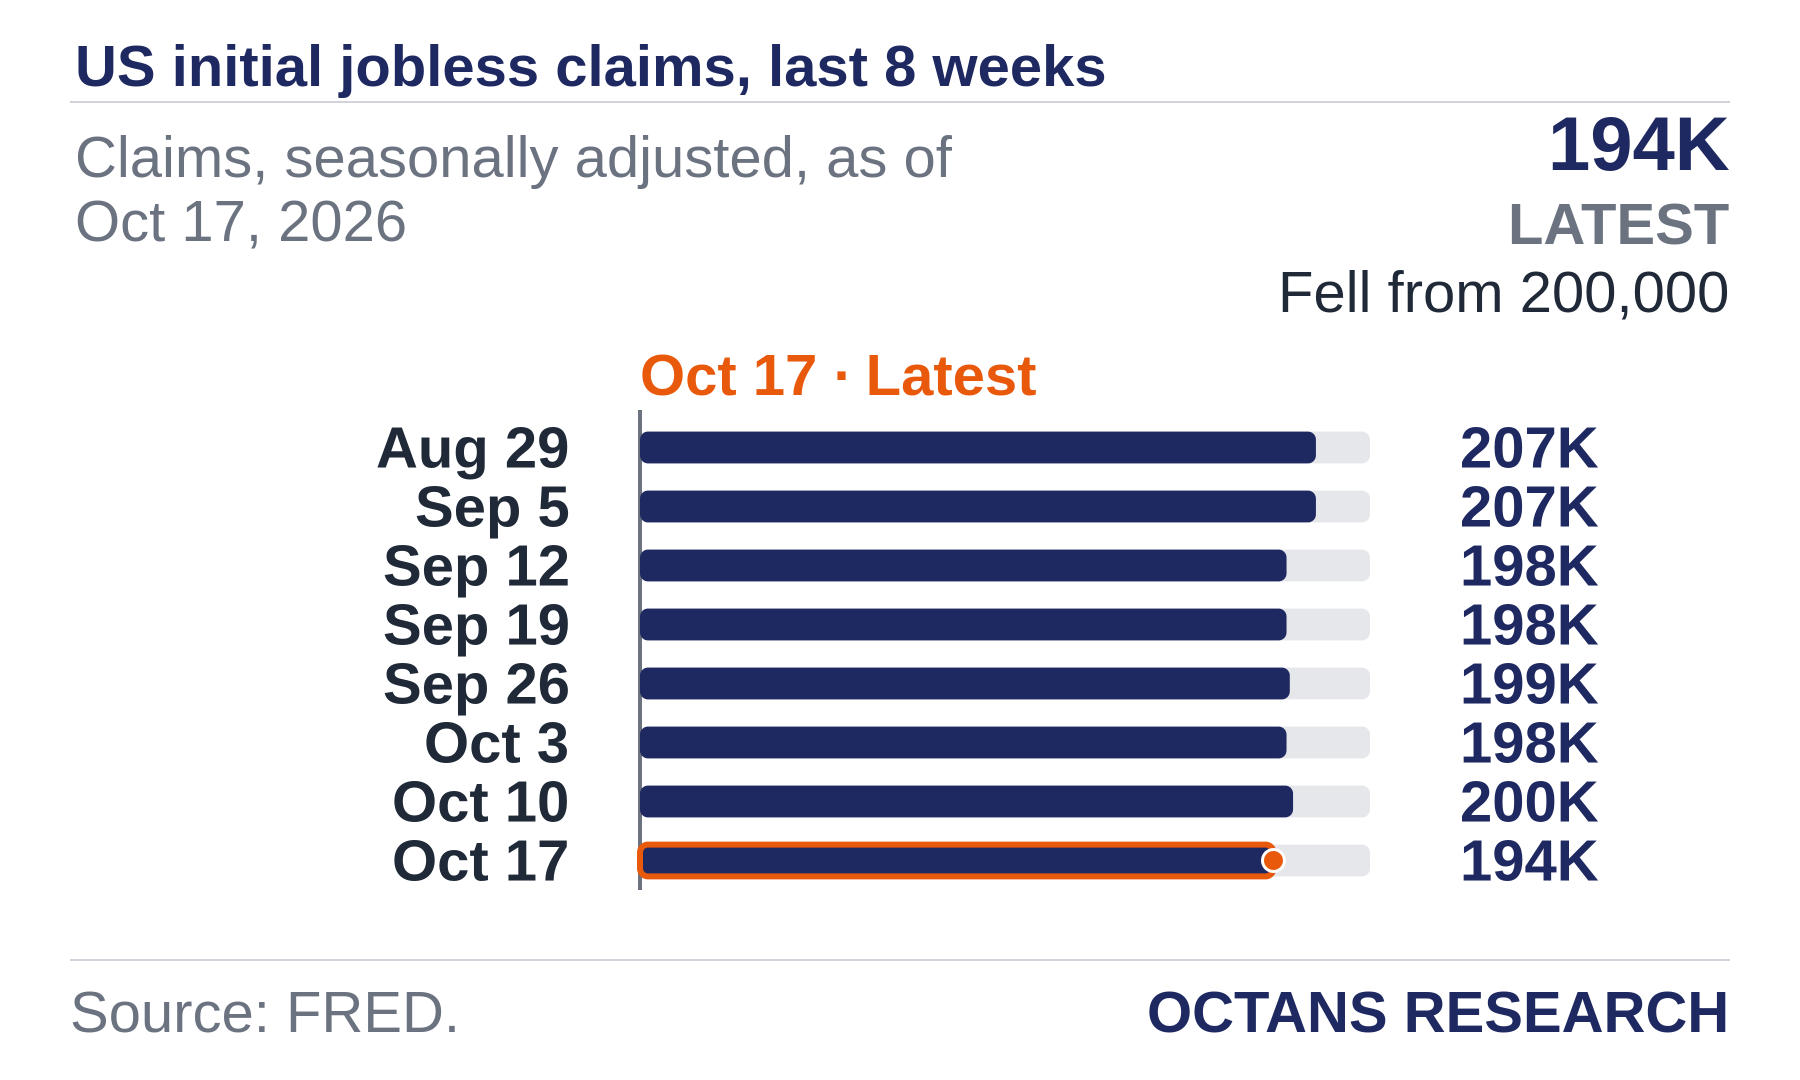
Initial claims for US unemployment benefits fell by 6,000 to 194,000 in the week ended Oct 17, 2026, seasonally adjusted, from 200,000 the week before.
- Independent Research
What We Know
The 4 week moving average was 197,750. Continuing claims, which run a week behind, were 1,728,000 in the week ended Oct 10, 2026.
Initial claims by week, oldest first: Jul 25 198,000; Aug 1 200,000; Aug 8 212,000; Aug 15 207,000; Aug 22 204,000; Aug 29 207,000; Sep 5 207,000; Sep 12 198,000; Sep 19 198,000; Sep 26 199,000; Oct 3 198,000; Oct 10 200,000; Oct 17 194,000.
Octans View
Weekly claims are volatile; the 4 week average smooths holiday and weather swings.
Bear Case · Room for Disagreement
Limits. These are the figures as the Department of Labor published them and FRED carries them today; later revisions can change them. The brief makes no forecast and does not compare the release with economists' expectations.
Method and source. Octans Research reads the series from FRED on release day. Published levels and rates are used as they are; changes are computed from the published levels, and "highest since" compares the latest reading with the full history of the series. The text is generated by a fixed template; no model wrote it.
Sources
- [1]Federal Reserve Bank of St. Louis (FRED) — Initial claims, seasonally adjusted (series ICSA)
- [2]Federal Reserve Bank of St. Louis (FRED) — Initial claims, 4 week moving average (series IC4WSA)
- [3]Federal Reserve Bank of St. Louis (FRED) — Continued claims (insured unemployment), seasonally adjusted (series CCSA)
These are the sources this piece was drafted from. How we verify. Found an error? Tell us and we correct it in public.
4 reports
Ten Year Treasury Auction Clears at Five Point Three Percent Before Constant Maturity Yield Eases
US Treasury auction data show high yield rose 46.6 basis points in October before constant maturity rates softened across subsequent trading sessions
US initial jobless claims rose to 199,000 in the week ended Oct 10, 2026
Weekly unemployment insurance claims, published by the Department of Labor.
US consumer prices rose 0.6% in September 2026; annual rate 3.7%
Consumer price index for September 2026, published by the Bureau of Labor Statistics.
Treasury 20 Year Auction High Yield Reaches 5.42 Percent as Secondary Yields Climb
September auction clears 21.6 basis points higher while secondary market yields sit above 5.6 percent in October